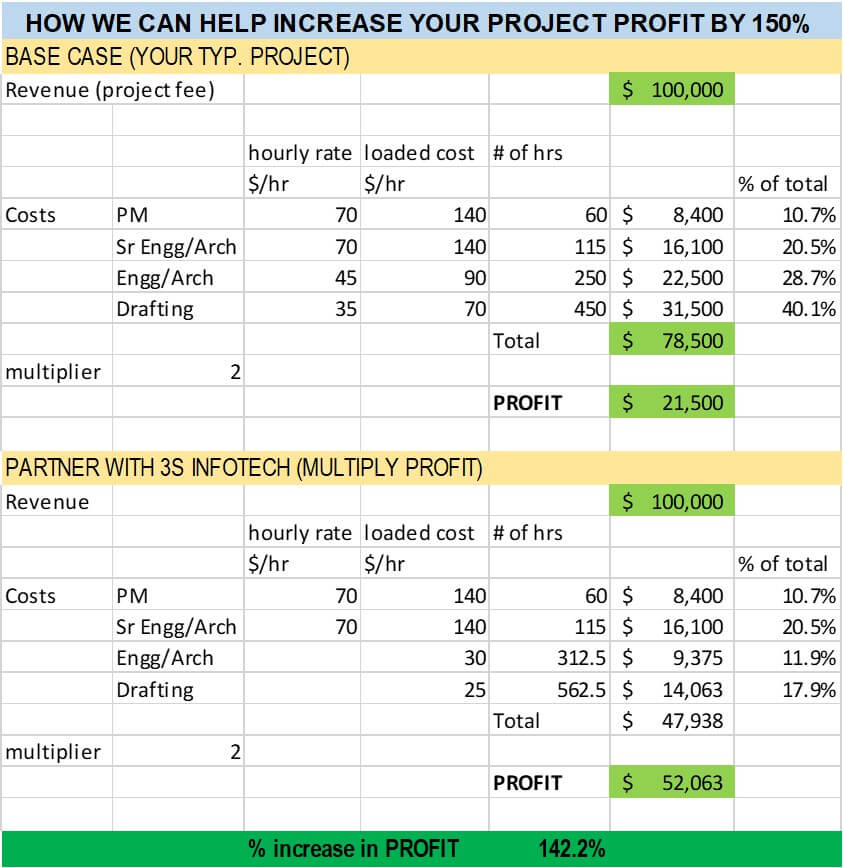
Power usage effectiveness can unlock stranded IT capacity and create a new source of revenue.
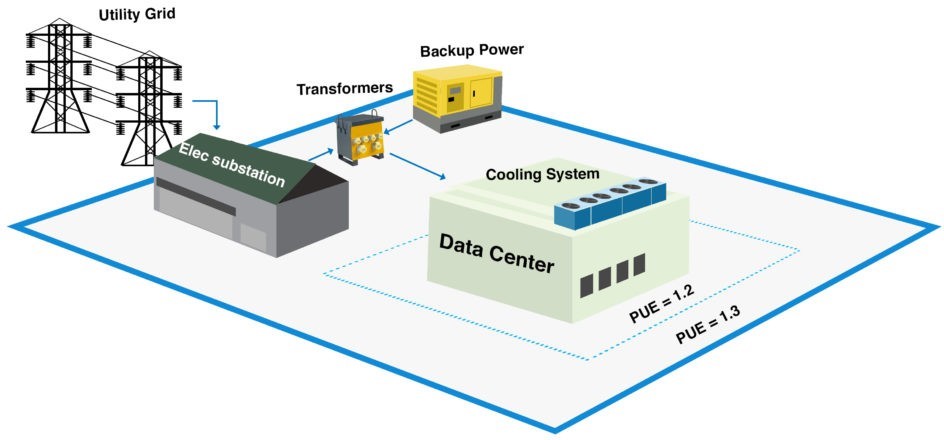
Figure 1: This shows examples of data center PUE boundaries. The most commonly reported boundary is shown by dotted line. Courtesy: EXP Global
Learning objectives
- Define power usage effectiveness, its origin and current industry trends.
- Learn about IT capacity, stranded capacity, equipment capacity and equipment IT capacity.
- Understand how to create new sources of revenues by reducing PUE and increase return on investment by improving PUE.
Power usage effectiveness has long been used as a benchmark for data center efficiency, but it is seldom looked at as a tool to unlock stranded information technology capacity and to create a new source of revenue. This new capacity takes little time to build and comes with minimal capital investment. The return on investment is less than six months and can help corporations postpone capital expense required to build capacity.
PUE is a metric that describes how efficiently a computer data center uses energy. It is the ratio of the total amount of energy used by a data center facility to energy delivered to computing equipment. It was originally developed by Green Grid and was quickly adopted by many data center players. PUE was published in 2016 as a global standard under ISO/IEC 30134-2:2016.
![]()
Reducing PUE not only lowers utility bill operating expenditures, but also allows for a lower cost of construction (a capital expense), thereby improving return on investment for investors. In existing data centers, it can unlock new revenue potential using existing mechanical, electrical and plumbing infrastructure. Most analysis around lower PUE only accounts for cost savings from reduced power usage. When new revenue potential is included and could lead to a much higher return for the owners and operators.
Uptime Institute conducts an annual survey of average PUE for data center player across the globe. In 2018 it reported an average PUE of 1.6 across 713 participating data centers spread across the globe with the majority of the participants located in the U.S. and Europe. Uptime Institute’s research and surveys have found that PUE has dropped consistently during the past 10 years from a high of 2.5 in 2007 to 1.6 in 2018.
Figure 1: This shows examples of data center PUE boundaries. The most commonly reported boundary is shown by dotted line. Courtesy: EXP Global
Google has aggressively adopted PUE as a metric to keep its own data center energy usage low. Its data center portfolio has some of the lowest PUE in the world. In Q4 2018 it reported a trailing 12-month PUE of 1 11 across its fleet of 15 data centers globally The company carefully defines IT load as processing power only; data center losses include power used by mechanical equipment, heat rejected by electrical equipment including uninterruptible power supplies, switchgear and feeders, plus utility transformers and electrical substation losses.
Defining PUE
There is a lot of ambiguity and inconsistency in how to measure PUE. Some players will include substation, step–down transformers, etc. in the PUE formula whereas others will measure power usage at the facility level. Telecommunication companies use centralized rectifiers, with 4 to 12 hours of lead-acid or valve- regulated lead-acid battery backup and feed direct current to switching and routing equipment. Most data entry operators use UPS systems with back–up batteries and feed alternating current to server racks, with a step–down transformer built into the server blades. These differences lead to inherent differences in PUE for different kinds of facilities.
Improving PUE not only helps with reducing energy cost but also can unlock valuable electrical and cooling infrastructure capacity. This will allow data center players to add revenue-generating IT capacity using existing electrical and mechanical infrastructure. Essentially this means adding sellable capacity without major infrastructure upgrade. The caveat is physical space constraints, which will not be considered here.
Measuring capacity
Most co-location data center companies sell IT capacity in kilowatts. IT capacity is sacrosanct for them. The more the IT capacity, the greater the potential revenue. Each kilowatt of additional IT capacity has a revenue potential of $200 to $300 per month. We will use $250/kilowatts/month in our calculations below.
We normalized capacity of mechanical, electrical and plumbing equipment in terms of kilowatt of IT capacity it can support. This allows for an easy comparison and analysis method. To achieve this, we defined a new term equipment IT capacity for each piece of mechanical cooling and electrical equipment in a data center. Equipment IT capacity is a function of peak PUE of the system, which in turn is a function of inefficiencies throughout the system.
Equipment IT capacity is measured in kilowatts. e = equipment
x = a variable and is the name of equipment for which IT capacity is calculated Equipment IT capacity for electrical equipment is calculated as below:
![]()
For example:
![]()
The available capacity of the switchboard is defined as the maximum continuous–duty capacity for the primary switchboard; redundant capacity is not counted. For example, some switchboards cannot be loaded more than 80% of their nameplate capacity for continuous operation. This data shall be obtained by the manufacturer and used in the calculations.
PUE of a data center varies with time and we define peak PUE as the highest observed PUE for the site during normal working conditions through the course of the year. For cooling equipment (chillers, computer room air conditioning, air handling unit, etc.) equipment IT capacity is defined as the available IT cooling capacity of primary cooling equipment on design day; again, redundant capacity is not counted.
For example, a nominal 600-ton packaged air–cooled chiller could only provide 500-ton capacity on the design day defined as 0.4% ASHRAE annual cooling design condition after de-rating for 30% propylene glycol. A similar concept could be applied for computer room air conditioning units or other pieces of equipment.
For uninterruptible power supplies and rectifiers, equipment IT capacity is defined as maximum continuous duty capacity. Note: The analysis above assumes that IT, cooling and other miscellaneous load is fed from the same source (utility service, generator and main service board), which is usually the case in most applications.
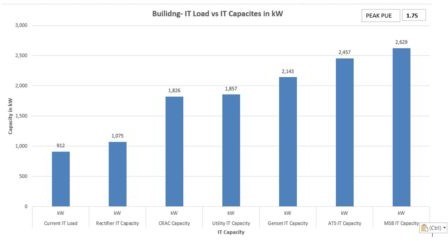
Figure 2: In this capacity analysis graph, IT load is compared to IT capacities. Capacities are extrapolated to 2020 for visualization purposes) at PUE 1.75. Courtesy: EXP Global
Calculating costs
In Figure 2, the computer room air conditioning, utility, generator set, automatic transfer switch and main switchboard capacity at the data center far exceeds current IT load. Data center operators and planners can use this to make informed decisions about the cost of adding IT capacity at their sites. Using this information, operators can come up with a step function showing cost of the mechanical, electrical and plumbing upgrade for each additional 250 kilowatt of IT load. This information could be very powerful.
This solves capital allocation problem for large data center owners. Owners now have a one-page cost step function for each data center, which they can use to figure where to install new racks with minimum capital expense. This data is rarely available and will solve an important problem for owners and operators.
Figure 3 shows the impact of lowering PUE to 1.4 from the current 1.75. It shows a significant increase in IT capacity of utility, generator set, automatic transfer switch and main switchboard. Lowering PUE unlocks IT capacity of electrical equipment because the power used by mechanical and other supporting Equipment is reduced.
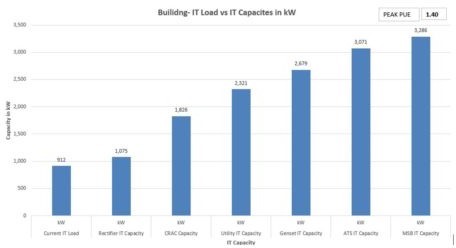
Figure 3: In this capacity analysis graph, IT load is compared to IT capacities. Capacities are extrapolated to 2020 for visualization purposes) at PUE 1.4. Courtesy: EXP Global
Completing a financial analysis
Situation: The facility is a 1 megawatt data center with peak PUE of 1.75 built in 2010. The data center is maintainable with the 2N electrical power system and N+1 mechanical capacity. It currently is operating at capacity. Available capacity of electrical infrastructure is 1.75 megawatts.
PUE improvement project: Mechanical energy–efficiency improvements lowered peak PUE to 1.4. Mechanical improvements included:
- Increasing supply air temperature and chilled water supply temperature. Containment of hot aisles and an increasing space temperature setpoint.
- Optimizing sequence of operations of chilled water pumps and set points of computer room air conditioning units.
- Installing adiabatic cooling pads on the condenser of the chiller plant.
- Adding isolation dampers that allowed shutting down redundant computer room air conditioning units. Rebalancing system to move air where needed.
- Optimizing lights and lighting controls.
Impact of PUE improvement on profit: Table 1 shows an impact on earnings before interest, tax, depreciation and amortization (gross profit) when PUE improvement resulted in both added IT capacity and savings from improved energy efficiency. In this scenario, 250 kilowatt of IT capacity was gained, which provided an additional $0.75 million annual revenue. Power cost (operating expenditures) didn’t change because mechanical, electrical and plumbing power usage was moved to support additional IT load. For sake of simplicity, it is assumed that expenditures only include power costs. Other costs are fixed and will not change because of peak PUE adjustment. Profit increased by 50.4%. Simple payback for this improvement is less than nine months.